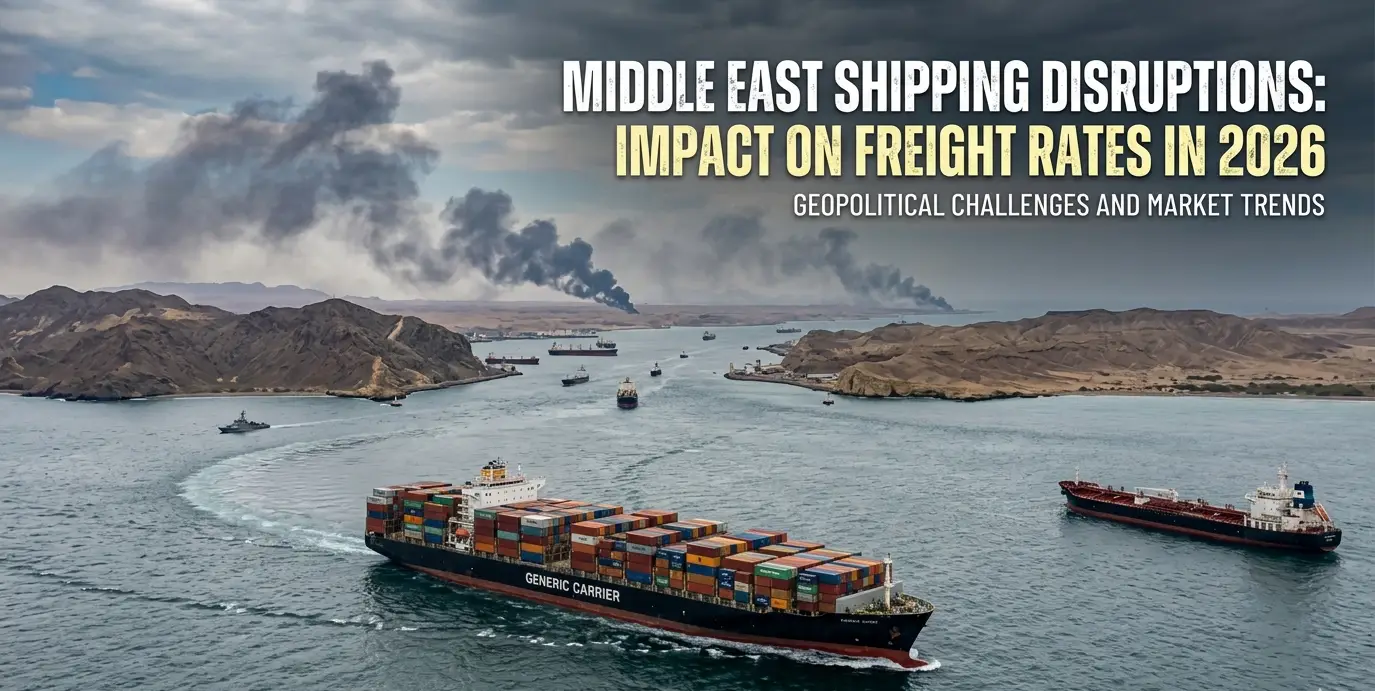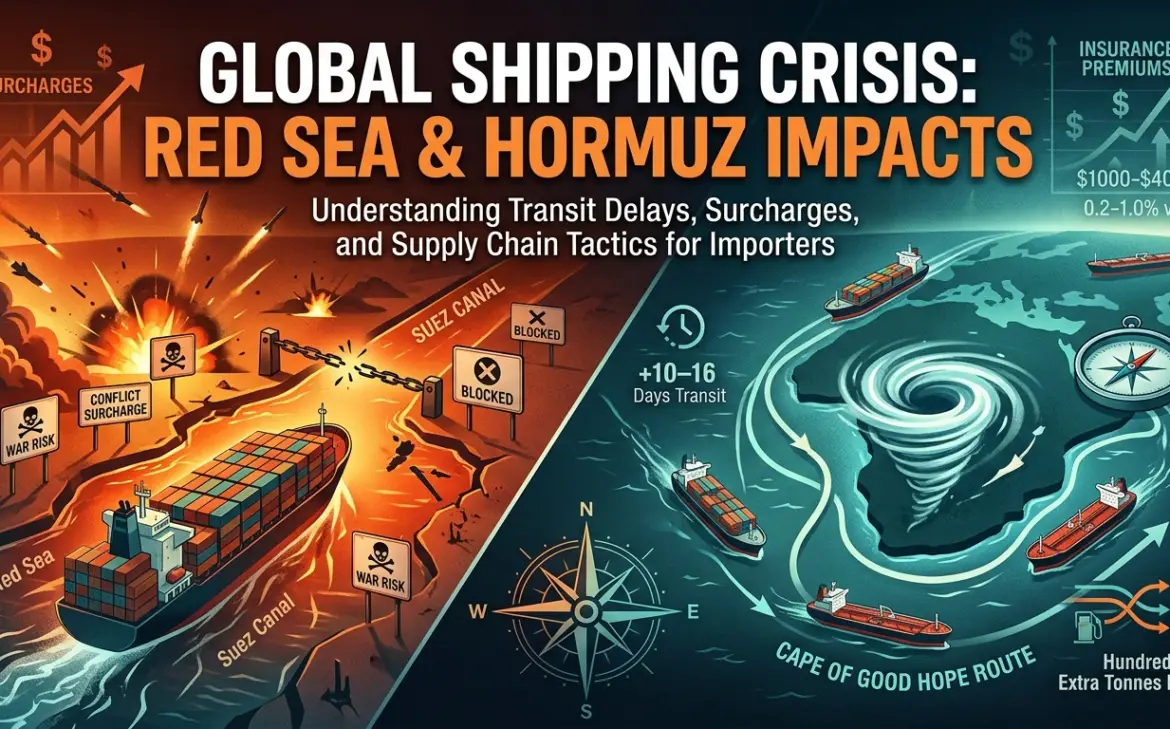
Executive Summary: Recent conflicts and attacks in the Red Sea and the Strait of Hormuz have forced shipping lines to reroute vessels around Africa, dramatically raising transit times and costs. Importers must adapt quickly: understand longer voyages (+10–16 days) and fuel consumption (hundreds of extra tonnes), higher port/insurance surcharges (often $1,000–4,000 per 40-ft container) and war-risk premiums (~0.2–1.0% of hull value). This guide explains the impacts – transit delays, surcharges, port congestion – and offers practical tactics (alt routes, contract clauses, hedges, consolidation, KPIs) to cut logistics costs. It includes data tables, a decision-flow chart, and a one-page checklist of actions for import teams. Takeaway: by proactive routing decisions, smart contracting and inventory planning, importers can cushion their supply chains and trim costs under these extraordinary shipping conditions[1][2].
Why Red Sea & Hormuz Matter
- The Red Sea/Suez route historically handles ~12–15% of world trade (up to 1/3 of Asia–Europe containers)[3]. When it’s closed or unsafe, ships detour ~11,000 nautical miles via the Cape of Good Hope[1], adding 10–14 days per voyage.
- The Strait of Hormuz carries ~20% of global oil flow[4]. Military strikes or closure there force tankers to reload (e.g. Ras Tanura→Yanbu pipeline) and container ships to skip Persian Gulf ports (Dubai, Jebel Ali).
- Impacts so far: Freight rates on affected lanes spiked (e.g. China–Europe container rates reportedly up 10–70%[5][1]). Bunker fuel jumped (Singapore VLSFO ~$1,068/ton[6]). Major carriers have reintroduced surcharges: e.g. CMA CGM raised its $150/TEU bunker fee to $265[7], and war-risk surcharges of $3k–4k/FEU are common on Gulf and Red Sea trades[8][7].
- Effect on inventory: Longer trips tie up vessels and inventory. Argus estimates avoiding the Cape (via Suez) would save an LR2 tanker ~$600k per round-trip (fuel+$345k plus hire+$510k minus canal fee$520k)[2]. But for importers, this means 16 extra days’ lead time when rerouting via the Cape[9][2], boosting working capital costs and demurrage risks.

Fig: Major ports like Salalah and Tanger Med are seeing surges as shippers divert cargo around Africa. (Source: pexels)[10][2]
Rerouting Costs: Time, Fuel & Fees
- Transit Time: Via Cape adds ~10–16 days (e.g. 19→35 days for Persian Gulf–Europe)[9][2]. Slower speeds (to save fuel) often increase this further.
- Fuel Burn: A large VLGC (LPG tanker) burns ~$30–35k in fuel/day[1]. For container ships, the extra 2 weeks can add ~$200–300k in diesel per ship. Argus shows LR2 tanker fuel/diesel savings ~$345k by returning to Suez[2].
- Port Fees: Port calling patterns change: Far further voyages skip some ports, but may call extra hubs. Cape route adds fees at additional ports (e.g. Cape transshipment costs). A single Suez toll is ~$0.5–0.6M (offset by save)[2].
- Insurance (War Risk): War-risk premiums rose ~10× early 2026[11]. For example, an LR2 tanker (~$100M value) now pays $100k–$200k extra per Gulf transit[12]. Container ships pay about 0.5–1.0% of value (~$50k–$100k per vessel)[12]. P&I insurers still cover transit but at high APs.
- Surcharges: Carriers imposed emergency fees. Typical examples:
- Bunker/EBS: CMA CGM upped its bunker surcharge from $150 to $265/TEU[7]; others did similarly.
- Conflict Surcharge: Many lines added $1,000–$4,000 per FEU for Red Sea/Gulf destinations[13][14]. Example: CMA/ Hapag set $3,000/FEU for Persian Gulf cargo[15]. Maersk and others have daily “GFS” or PSS surcharges for diverted cargo.
- Peak/GRI: Drewry reports carriers announcing GRIs and Peak Season Surcharges (often $1k–$3k/FEU more) on top of existing rates[16]. (Importers should watch contracts for surcharges clauses.)
Port Congestion & Alternative Hubs
Port shifts are creating new chokepoints: – Traditional hubs: Singapore, Colombo, Mundra and Salalah handled more Gulf-bound cargo[17]. These are now congested (Singapore delays ~3.5 days early 2026[18]).
– Emerging hubs: Tanger Med (Morocco) boosted transits +8.4% in 2025[19], positioning for more Europe-bound freight. UAE ports like Duqm (Oman) and Jebel Ali (int’l transfers) are in use. Pakistan’s Karachi saw 8,300+ containers in 24 days (up from 0)[20].
– Data: Mundomaritimo reports 50% Port Klang, 46% Colombo, 36% Singapore congestion rises[21]. Freightos notes Pakistan/India ports are redirecting Middle East flows via inland connections[17].
– Advice: If your cargo diverts, track which ports are chosen. Build relationships with known feeder carriers at Salalah, Mundra, Tanger, etc. Use “OOG/DDU” clauses if transferring to smaller ships or land routes.
Actionable Checklist for Importers
- Review routes daily: Monitor war reports and shipping alerts (e.g. UKMTO, Lloyd’s List). If Red Sea is off-limits, plan ahead for Cape voyages.
- Adjust lead times: Bump lead times by 10–14 days for Asia–Europe/East shipments to account for rerouting[9]. Inform sales/inventory teams of delays.
- Negotiate fuel/war surcharges: Talk to carriers about capping EBS/PSS increases, or passing them through only on diverted shipments. Use FAK (flat all-kinds) rates where possible.
- Consolidate & slow-steam: Where deadlines permit, consolidate LCL loads to FCL to reduce per-unit surcharges. Slow-steaming can save ~20% fuel (offsetting some surcharge).
- Insurance check: Ensure cargo policies cover war zone risks (e.g. pile-up of hull war risk onto cargo all-risk). Consider additional cargo insurance.
- Multimodal alternatives: For critical parts, investigate short-sea (e.g. via China–Russia–Europe rail), or air freight for high-value items.
- Inventory strategy: Increase buffer stock of essentials (oil, chemicals, components) to cover rerouting delays. Move to “just-in-case” model temporarily.
- Financial hedges: Use bunker fuel hedges or Lloyd’s syndicate FFA contracts to lock in charter rates. (Port fuel index hedging can cap volatility.)
- Procurement alignment: Work with suppliers to accelerate shipments pre-crisis or split shipments (e.g. some via land, some via sea). Factor higher freight into landed cost budgets.
- KPI monitoring: Track Transit Days, Freight Cost per unit, On-Time %, Inventory Days Supply, Demurrage/Detention (days/$), and Insurance Cost as % of value. Watch these for spikes to trigger contingency plans.
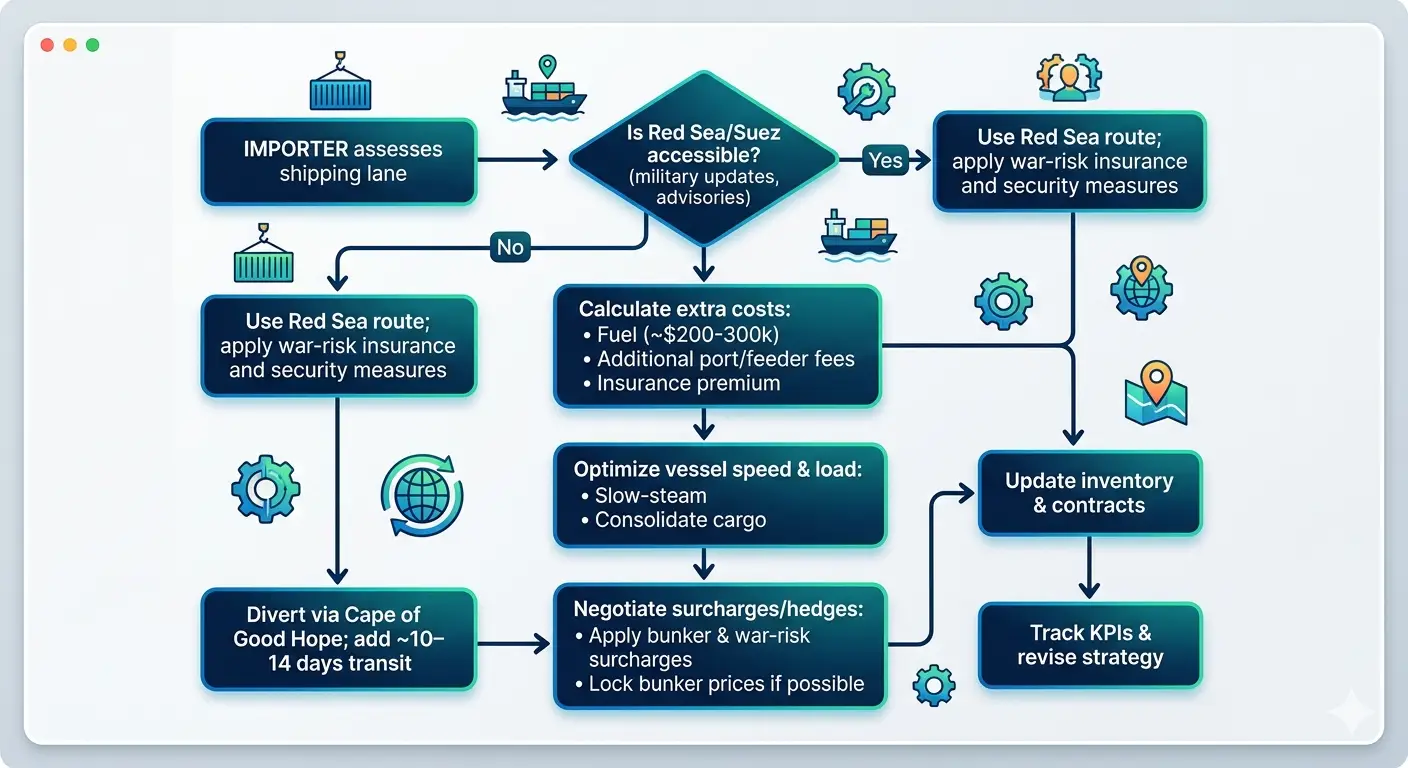
Port & Routing Decision Flowchart
Sample Costs and Surcharges
| Cost Item | Normal (pre-2024) | Diverted (via Cape) |
| Asia–EU (N. Europe) 40’ box | ~$2,500/FEU* | ~$2,800–3,000 (+10–20%)[22] |
| APM Terminals 40’ (fuel surcharge) | $150/FEU | $265/FEU (CMA EBS)[7] |
| Red Sea War-Risk (hull, 30d) | ~0.0001% hull (negligible) | ~0.5–1.0% hull (~$50k–$100k)[12] |
| Dubai to Rotterdam tanker (LR2) | ~$2.6M round-trip | +$345k fuel +$510k hire –$520k Suez toll[2] |
| Longest route ships needed | 1 (Suez) | 1.5 (Cape detour) – effectively 50% more days[23] |
| Port fee (Suez) | — | ~$520,000 (LR2)[24] |
* Spot rates vary by week; use approximate center values.
Checklist (printable): See below for a one-page checklist of actions to mitigate costs and delays. (Also attached at URL or Appendix.)
Procurement & Contracts
- Cost Allocation: Pass through unavoidable costs by adjusting incoterms (e.g. DDP buyer pays extra war-risk insurance). Charge customers a “route surcharge” if contracts allow.
- Force Majeure: Include broad FM clauses covering military conflict and port closures[25][7]. Also specify “insurance availability” conditions.
- War-Risk Clause: Explicitly stipulate that any additional war-risk premiums or Suez transit fees are for buyer’s account. Example: “Any war risk insurance or Red Sea transit premium shall be borne by Buyer”.
- Demurrage/Detention: Negotiate liability caps or waivers if delays exceed a threshold due to rerouting or hubs congestion. Consider “extended free time” in Asia/Europe.
- Contingency Plans: Contractual right to reorder via alternate port or mode with minimal penalty. Include “herwhere permitted” phrasing to use any safe route if original is blocked.
KPIs to Monitor: Transit time (vs baseline), freight $/unit, on-time delivery %, # of diversions/surcharges applied, additional insurance $/shipment, inventory days of supply, detention charges.
Data Gaps/Assumptions: Freight figures above are estimates from spot markets in early 2026. Actual surcharges vary by carrier and commodity. We assume an LR2 tanker (~$100M value) for war-risk calcs. Container rates fluctuated ($2–3k FEU). Check carriers (Maersk/CMA) for current surcharge notices.
References: Industry sources including container-news[1][26], Drewry/Freightos[22][7], Lloyd’s List[11], Argus[2], ACW/DHL/Zawya news[25][14].