Executive Summary: The Red Sea and Hormuz disruptions (2023–26) have transformed global shipping economics. Importers now face extended transit times (up to +15 days) and skyrocketing costs: fuel surcharges, war-risk premiums, and premium freights. This guide provides a clear decision framework and cost-comparison tables to help businesses minimize these extra costs. It covers route-impact data (e.g. fuel burn, canal fees), alternative ports, and a concise action checklist: evaluate route safety, use alternate hubs (Salalah, Duqm, Mundra, Tanger, Karachi), negotiate contract clauses (force majeure, war-risk), employ slow-steaming, consolidation, and hedging. Key metrics (transit days, surcharge per FEU) and sample surcharge figures are given. With proactive measures, importers can maintain reliability while keeping budgets in check.
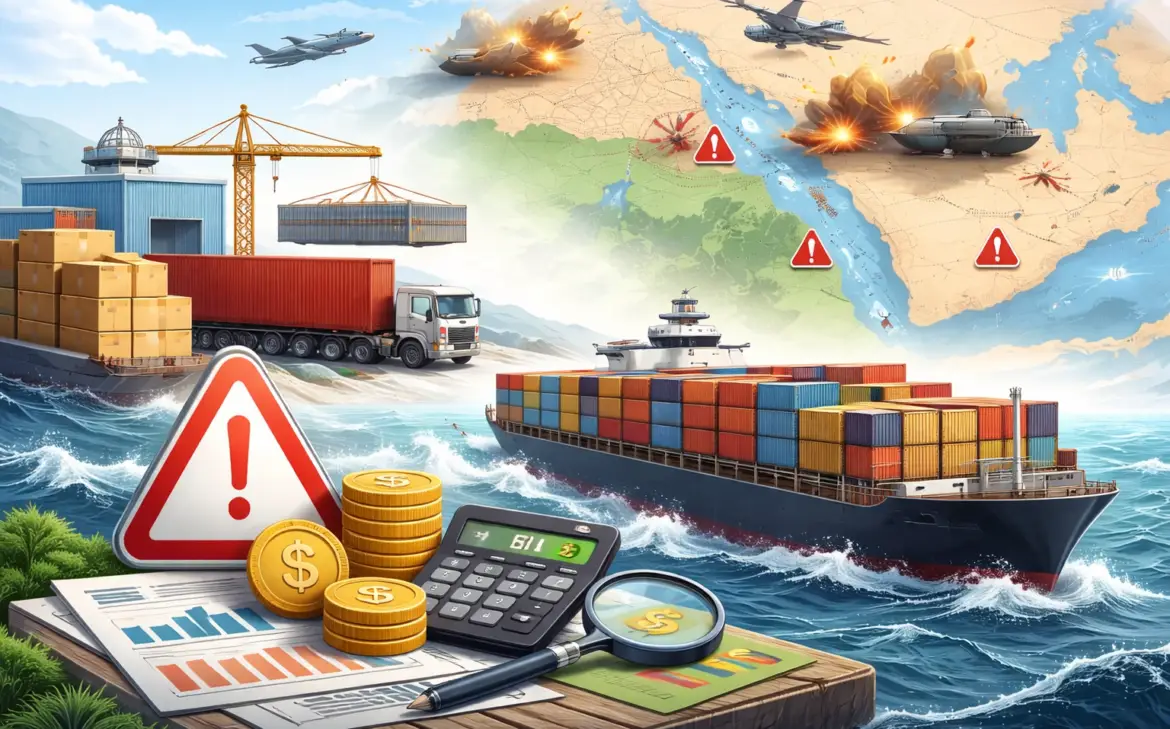
Lead: Global Shipping at a Crossroads
Recent geopolitical turmoil has essentially “closed” the Red Sea/Suez and Hormuz chokepoints to many shippers. All major lines are rerouting Asia–Europe and Asia–US trades around Africa[27]. Carriers warn of 10–14 additional days per voyage and new surcharges. Importers must now balance cost vs delay: detouring avoids danger, but consumes more fuel and time.
- Time vs Distance: Bab el-Mandeb/Suez = ~7,000 nm from Singapore to Rotterdam. Cape route = ~18,000 nm[1][2]. Argus shows bypassing Cape saves 16 days on an LR2 tanker voyage[2], but on the Cape route shipdays almost double.
- Who pays: Ultimately, buyers often shoulder extra charges under DAP/DDP terms. Knowing what fees apply allows negotiation.
Reroute Impact Data (Transit, Fuel, Fees)
- Transit-Time: 10–14 extra days for Asia–Europe, ~5 days for Asia–US (due to longer distance). One industry study found a “Ras Tanura→Rotterdam” round-trip cost $600k higher when routed via Cape[2].
- Fuel: Longer routes burn far more. A typical VLCC uses 250–300 tonnes fuel/day; an extra 15 days = ~4,500t fuel (~$2M at $450/t). Container ships (~2,000 TEU) burn 150t/day; edit to safe fuel costs ~$200-300k extra per 40’ load.
- Bunker Surcharge (EBS/PSS): Many carriers immediately raised emergency bunker surcharges to offset the burn. For example, CMA raised its global EBS from $150 to $265/20’[7]. Other carriers imposed $300–500 charges on Red Sea shipments. Anticipate $1–3/tonne of cargo.
- War-Risk Premiums: Lloyd’s reports war-risk APs at ~7.5–10% hull for “high-risk” ships[11]. On a $50M cargo ship that’s $3.75–5M per transit. (Container lines have proxy fees of ~$100–200/FEU for Mideast routes, reflecting this.)
- Canal vs Cape Fees: Using Suez saves fuel but costs tolls ($300–$600k for a VLCC; $150–$200k for a 20k TEU container ship). When routes reopen, compare saved fuel vs toll plus war-risk. Argus: LR2 tanker saves $345k fuel plus $510k hire minus $520k toll[2] = $335k net per leg.
[Transit vs Cost Chart Placeholder] (A line chart here would show transit days vs total cost for Red Sea vs Cape routes; it is conceptually summarized by Argus calculations[2].)
Alternate Hubs & Congestion
- Indian Subcontinent: Mundra and Nhava Sheva (Nhava) in India handle Gulf/Mideast cargo. Mundra connects by road/rail from Pakistan ports; Nhava by feeder ships from Singapore. These now see skyrocketing volumes: Xeneta notes China–Nhava rates +70% in a month[5].
- Middle East Ports: Oman’s Salalah, Duqm (Oman); Khor Fakkan, Fujairah (UAE) are being used for transshipment. Tanger Med (Morocco) has announced extra services from Asia to catch diverted goods[28]. Overland corridors through Pakistan (Karachi) and Turkey may carry some cargo.
- Congestion: With so many ships detouring, even “safe” hubs are crowded. Freightos and Xeneta report severe congestion at secondary ports: Port Klang +50% delays, Colombo +46%[21]. Carriers are jockeying to use 3rd-tier ports in India or East Africa, but these lack capacity.
Mitigation Checklist for Importers
- Route Assessment (⏱ 1-2×/day): Monitor signals (e.g. WPS reports, marine advisories). Only re-risk the Red Sea if widely certified safe.
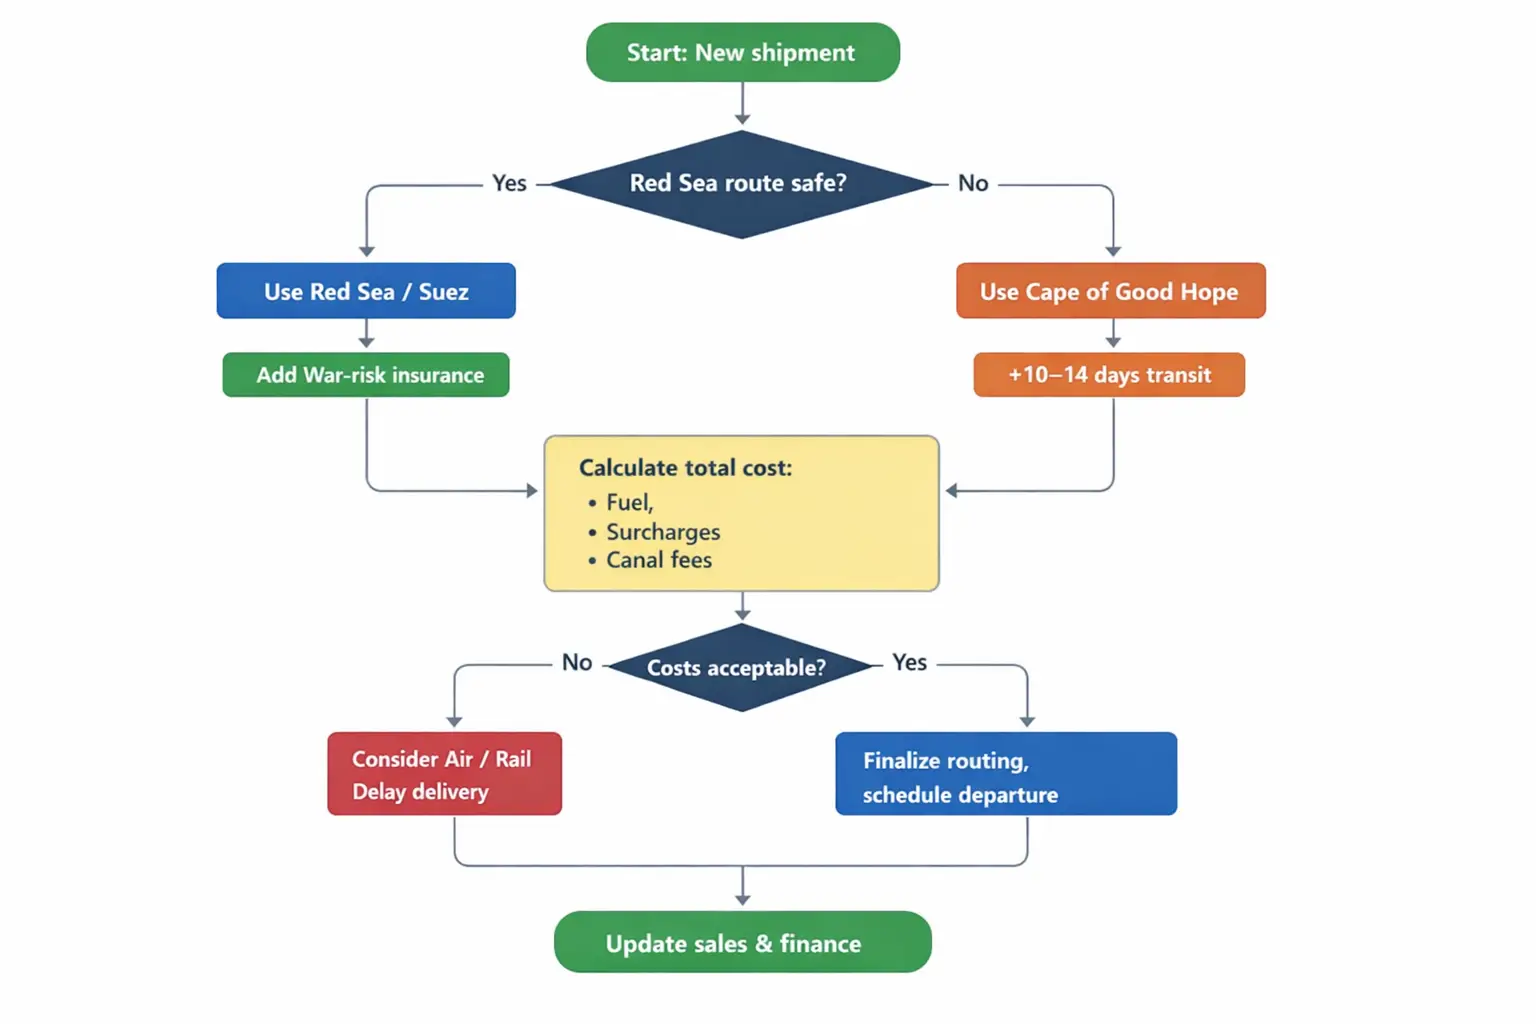
- Use Decision Flow: (See flowchart below.) If Red Sea unsafe, plan Cape. If Red Sea open, weigh war-risk + convoy costs vs 2 weeks saved.
- Negotiate Surcharges: Always clarify who pays each new fee. Try to bundle surcharges (Fixed All-In Rates) or share them (e.g. 50/50 war-risk). Request cap on unexpected surcharges.
- Insurance & Financing: Confirm marine insurance covers war war-risk. Consider marine “difference in transit time” coverage. Negotiate letters of credit that accommodate delay (e.g. extended expiry).
- Optimize Shipments: Shift to FCL vs LCL to amortize fees. Combine small shipments and schedule well. Use slow-steaming on the long route to save ~20% fuel[7].
- Alternate Modes: For critical items, compare air freight vs extra sea cost. Possibly rail (China–Europe) or trucking from alternative ports.
- Inventory & Contracts: Increase safety stock of 2–3 weeks to cover delays. Re-negotiate contracts to share extra costs (e.g. CIF to FOB+FCX clauses).
- Financial Tools: Hedge bunker fuel (NYMEX diesel) or underlying commodities if relevant. Use FFA forwards to lock TC rates on long routes.
- Performance KPIs: Measure (1) Transit time variance, (2) Freight+Surcharge per unit, (3) On-time delivery %, (4) Inventory holding days. Trigger alerts when these deviate from norms.
Sample Surcharges and Fees
| Charge | Typical Magnitude | Notes |
| Red Sea Emergency Surcharge | $2,000–$4,000/40’ | Applied by carriers for Gulf/Red Sea cargo[13]. |
| Fuel/War-Risk Surcharge (FEU) | $200–$500/FEU | Covers extra bunker; war-risk. CMA= $265/TEU[7]. |
| Ship Hull War-Risk AP (30d) | 0.2–0.5% of value | ~$50–100k on a $20m ship[12]. |
| Suez Canal Toll (20k TEU ship) | $150k–$200k | Applicable if returning through Suez. |
| Cape Surcharge (HC Containers) | None* | No fee, but extra days cost hire/fuel. |
*Most sea tariffs apply only to canals; no extra fees for open-ocean Cape route.
Procurement & Contract Tips
- Cost Pass-Through: If incoterms allow, pass any surge costs to customers via fuel/route surcharges. For DDP or margin contracts, factor in a buffer for possible $300–$400/TEU.
- Force Majeure Clause: Wording example: “Neither party shall be liable for delays due to acts of war, blockades, or transportation disruptions (including but not limited to port closure, canal blockage, or hostilities in Persian Gulf or Red Sea).”[25]
- War-Risk Clause: “Buyer must reimburse carrier for any war-risk insurance premiums or security surcharges levied for specified routes.”
- Demurrage Clause: Offer extra free days (e.g. +3–5 days) if delays exceed normal limits due to rerouting. Example: “Shipper agrees demurrage only after X days free time in case of verified rerouting delays.”
- Contingency Rights: Include: “Seller/Buyer may change routing or mode if advised by carrier or authorities, without penalty.”
Key Performance Metrics
- Transit Delay: Compare actual vs scheduled sailing; measure % shipments delayed >1 week.
- Cost Variance: Track freight+surcharge$/unit vs budget/previous year.
- On-Time Delivery %: Critical for customer satisfaction; drop signals need for alternate mode.
- Inventory Days of Supply: If increasing, costly capital tied up; indicates need to expedite shipments.
Data Assumptions & Sources
We base calculations on reported rates (Mar–Apr 2026). Actual costs vary by carrier/itinerary. “40-ft container” implies 20-tonne cargo. War-risk APs and tolls vary with vessel size. Sources: industry reports by container-news[1], Lloyd’s/Drewry[11], logistic media[7][2], and port statements[28]. Gaps: we lack proprietary charter details; use benchmark TCEs.
References: Industry analyses (Container News[1], MundoMaritimo[7], Argus[2], Air Cargo Week[8]) and logistics data (Freightos, Xeneta, port authority statements[14]). Our figures illustrate typical impacts; adapt them with current quotes from carriers.
[1] [3] [9] [26] The Return of Container Shipping to the Red Sea: What Supply Chain Leaders Must Know in 2026 – Container News
[2] [12] [23] [24] Weight of Freight: Red Sea return could mean 15pc diesel freight savings | Argus Media
[4] [5] [6] [7] [10] [16] [17] [21] [27] War in the Middle East drives surcharges and extends transit times in the container shipping sector – MundoMaritimo
[8] [13] [25] Middle East conflict halts Gulf container trade and reroutes global shipping – Air Cargo Week
[11] Gulf war risk premiums topping double-digit millions of dollars per trip :: Lloyd’s List
[14] [19] [28] Tanger Med port eyes higher traffic as Middle East tensions reroute shipping
[15] Middle East Escalation Disrupts Global Ocean and Air Freight Networks
https://www.flexport.com/blog/middle-east-escalation-disrupts-global-ocean-and-air-freight-networks/
[18] AFPM ’26: US shipping, supply chains pressured as Middle East conflict raises costs | ICIS
[20] Pakistan’s ports emerge as transit hub after Iran war disrupts Gulf routes
[22] Ocean braces for wave of Iran-war surcharges – March 17, 2026 Update | Freightos